Introducing the Transnational Climate Impacts Index: Indicators of country-level exposure – methodology report
Introduction
Climate change mitigation is widely regarded as a global problem, but climate change impacts and adaptation are typically described as regional or local issues. This reflects the location-specific nature of physical impacts, but it fails to recognize the many interconnections among countries and regions, particularly in an increasingly globalized economy.
This paper* introduces a new framework for examining climate change impacts and adaptation needs from an international perspective. Based on this framework, the authors develop indicators of country-level exposure to what they call the transnational impacts of climate change: those that occur in one place as a consequence of climate impacts somewhere else. The indicators make it possible to quantify each country’s exposure across multiple dimensions. The authors also construct a composite index: the Transnational Climate Impacts Index.
The paper explains the rationale and methodology by which the authors selected the indicators, which are intended to be further developed in the future. There are significant opportunities to strengthen and deepen the quantitative assessment of exposure to transnational climate impacts, including via applications of the framework at the national rather than global level.
The work described in this document is preliminary, intended to spark discussion and raise awareness about the potential significance of transnational climate risks. We welcome constructive feedback from readers and invite suggestions for collaboration and future research. Please leave a comment below or start a coversation in the Discussion Forum for Adaptation without Borders.
*Download from the right-hand column. A brief overview of the indicators, methodology and some lessons learnt are provided below. See the full text for more detail, and to for global maps of current exposure to climate risk for each indicator and associated discussion.
The Indicators
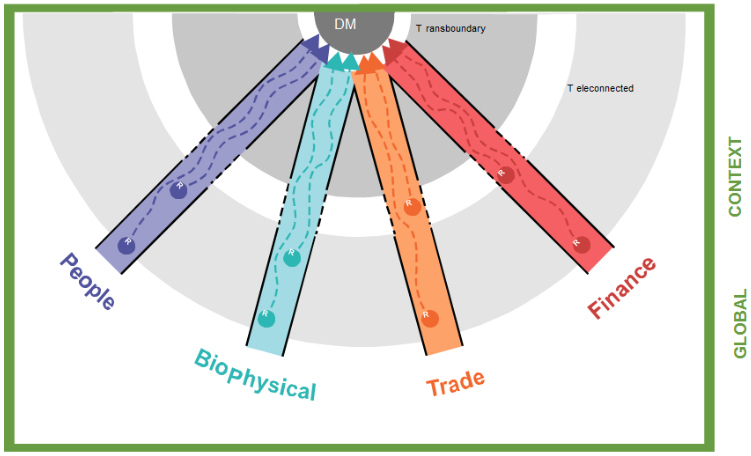
Direct impacts in one country may be transferred by various flows to affect another country: what we call transnational climate impacts. We identify four climate risk pathways through which impacts can be transferred. These are shown below alongside the developed indicators (after Benzie (2015) – see full text for more detail, including data, assumptions and justifications used):
The biophysical pathwayencompasses transboundary ecosystems, such as international river basins, oceans and the atmosphere. Adverse climate impacts on one part of a transboundary ecosystem can create impacts for all the countries that share the ecosystem’s services. For example, heat wave- and drought-induced forest fires in one country can disturb the air quality of countries far away down-wind. Furthermore, countries’ responses to climate change, for example by building new dams or diverting more water into irrigation, can have massive impacts on downstream countries via this pathway.
- Indicator 1: Transboundary water dependancy ratio
The finance pathwayrepresents the effect of climate impacts on the flow of capital, including the exposure of both publicly and privately held assets overseas that suffer lower yields or devaluation as the result of major disasters, or over time as climate change erodes the profitability and returns from various enterprises. Climate impacts will also affect private capital flows, for example when extreme weather renders migrant workers unemployed, stemming the flow of remittances “back home”.
- Indicator 2: Bilateral climate-weighted foreign direct investment
- Indicator 3: Remittance flows
The people pathwayencapsulates the effect of climate change on the movement of people between countries, for example as a magnifier or driver of new migration patterns, or via the economic impacts of new tourism patterns or climate-sensitive human health risks that result from the movement of people across borders.
- Indicator 4: Openess to asylum
- Indicator 5: Migration from climate vulnerable countries
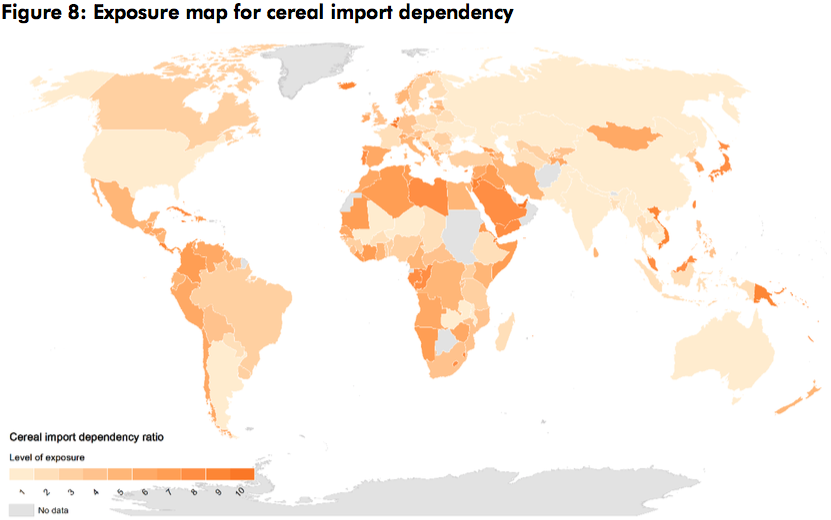
The trade pathwaytransmits climate risks within regional and global markets and across international supply chains. For example, where severe drought decimates harvests in producer countries, the effects on commodity price are felt acutely by import-dependent countries thousands of miles away. Countries’ response to climate impacts at home, for example the growing tendency of governments to use export restrictions during poor harvests, to protect food prices in domestic markets, can trigger price shocks and negative impacts in other faraway countries.
- Indicator 6: Trade openess
- Indicator 7: Cereal import dependency ratio
- Indicator 8: Embedded water risk
The framework also recognizes the influence of climate change beyond a country’s borders on the global contextin which all countries’ adaptation decisions are taken and implemented. For example, under various scenarios, climate change may alter or worsen the security situation in many regions, influencing the range of options – or the costs, benefits and rewards of specific adaptation measures, and the general scope for sustainable development.
- Indicator 9: KOF Globalization Index
Methodology (in brief)
Unlike existing global indices that aim to show vulnerability to climate change, the indicators in this paper focus on exposure and, to some extent, sensitivity to transnational climate change impacts. The reason we have made this distinction is to avoid the additional layers of complexity and context-dependency that are involved with comprehensive assessments of vulnerability. Our indicators focus on the characteristics of countries – such as their openness and reliance on other countries or global systems, and interaction with others – that may influence their risk profile.
It is also important to make clear that the TCI indicators assess current exposure, based on actual data. It is also important to clarify that according to our framework, transnational impacts can be both positive and negative.
Indicator selection methodology
Indicators were identified and selected via a three-stage methodology (see the full text for details):
- Defining the characteristics of interest.
- Consultation with academic experts in climate change and indicator development.
- Data sifting to identify datasets with balanced global coverage.
The majority of data used in the indicators are from freely available public sources. One indicator is produced using original modelling analysis by models developed at SEI.
Bilateral climate-weighted indicators
We identified two dimensions of exposure at the national level: (1) a country’s openness and reliance on international flows, and (2) the climate risk in specific countries that it is linked to. The selected indicators each relate to one of these aspects.
Indicators of the first type aim to assess characteristics of individual country profiles in terms of openness to and reliance on international flows and systems. Indicators of the second type use bilateral data to describe the nature of a flow between specific countries. They aim to assess the nature of an individual country’s links to specific other countries, and where possible weight those links based on climate vulnerability. To assess a country’s links to “climate vulnerable” countries, we used the ND-GAIN Country Index, which measures national climate vulnerability globally (see the full text for more detail).
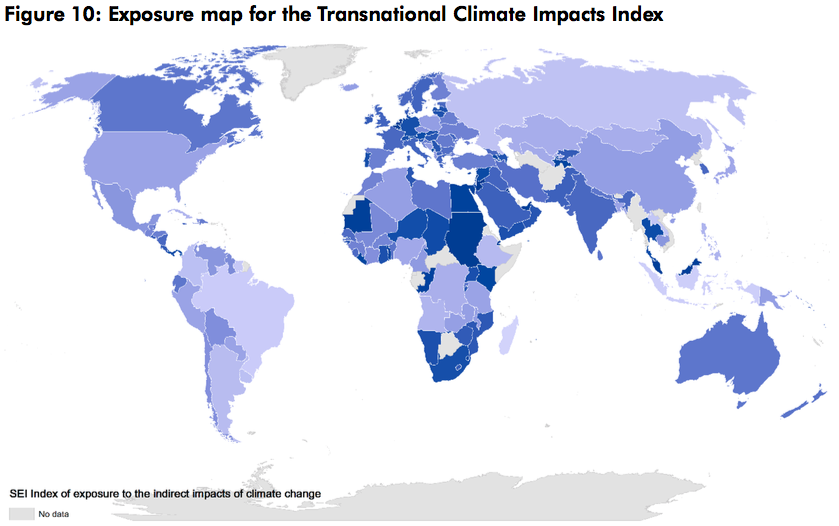
The Transnational Climate Impacts Index
The Index is a simple composite index that combines the results from each indicator. They are unweighted, as we have found little justification for giving more or less weight to specific indicators at this stage.
A total of 203 countries are included in the analysis, coded by the ISO325 standardized country codes. The index maps use the Robinson map projection and have been created in ArcGIS software. The data are from the years 2007–2013.
See the full text for further details of the calculations and data sources.
Key Messages
- The many links and flows between countries mean no country is fully insulated from the negative impacts of climate change outside its borders. Previous indicator and index studies have put forward a rather uniform view of “which countries are vulnerable to climate change”, based on a conception of vulnerability that is limited to what this paper calls “direct” climate impacts, meaning those occurring within national borders. It is questionable whether such indices tell us anything beyond what we already know: that poor countries with low levels of human development will be most affected by climate change, and that wealthy, industrialized countries are largely immune to the effects of climate change in poor countries. A key contribution of the framework put forward in this paper, and the initial results of the TCI Index, is to offer a complementary and more complex perspective on how exposure to climate risk may be experienced in the real world.
- It is important to recognize that what we are trying to quantitatively assess is a system with huge degrees of complexity, and as with all such indices, the results depend on the indicators chosen. Hence, the selection process needs to be transparent, and the ultimate choice of indicators needs to be well justified and explained. We have striven to make clear the limitations of the study as a decision support tool and to be entirely transparent about the level of analysis. Our view is that the indicator results presented here and TCI Index should be used to raise awareness and start discussions, but not yet to inform decision-making.
- The goal of the framework and the TCI Index is to facilitate quantitative analysis of this emerging concern in climate impacts and adaptation research. An important question is whether meaningful quantification of this highly complex phenomenon is at all possible, or even worthwhile. Please leave your comments below!

Comments
There is no contentYou must be logged in to reply.